Stats Chapter 1
For this chapter project we took a survey on what peoples favorite pop is.
For our survey we asked everybody in our stats class what their favorite pop is between Mountain Dew, Coke, Root Beer and Sprite. The winner was very clear as it stood out in our data collection. To see how we collected and chose our data hit the learn more tab.
Stats Chapter 2
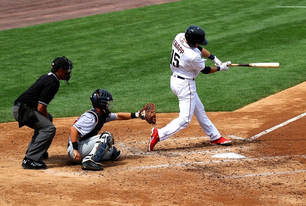
In this project we took the 50 best best batting averages in MLB history. We took this data and created a frequency table, a histogram, pie chart, pareto chart, an ogive, a relative frequency graph and a stem and leaf plot. To see our tables and graphs hi the learn more button below.
In this project we took the 50 best best batting averages in MLB history. We took this data and created a frequency table, a histogram, pie chart, pareto chart, an ogive, a relative frequency graph and a stem and leaf plot. To see our tables and graphs hi the learn more button below.

Stats Chapter 3
For this project we surveyed how many people were in the immediate family. We surveyed 13 people from each grade in Fowler High School. With the data we collected we found the mean,median and mode. Our numbers ranged from the lowest being 3 to our highest being 18. We also collected more information and to see the rest click on the learn more button.
For this project we surveyed how many people were in the immediate family. We surveyed 13 people from each grade in Fowler High School. With the data we collected we found the mean,median and mode. Our numbers ranged from the lowest being 3 to our highest being 18. We also collected more information and to see the rest click on the learn more button.
Stats Chapter 4
For this project me and my partner Victor surveyed people on "How many hours they spend playing video games a week?" and "What their GPA is?" We wanted to see if there was any correlation between the two and that if there was if it was positive or negative. We found that it was a small correlation. To see if it was positive or negative click the learn more button below.
For this project me and my partner Victor surveyed people on "How many hours they spend playing video games a week?" and "What their GPA is?" We wanted to see if there was any correlation between the two and that if there was if it was positive or negative. We found that it was a small correlation. To see if it was positive or negative click the learn more button below.
Stats Chapter 5
For this project me and my partner Taylor studied the probability of drawing M&M's out of a bag. to do this we had to pick two colors that we wanted to study. The colors we picked were brown and red. To predict the probability we used the formulas we learned in class. To see these formulas and more of our project click on the learn more button below.
For this project me and my partner Taylor studied the probability of drawing M&M's out of a bag. to do this we had to pick two colors that we wanted to study. The colors we picked were brown and red. To predict the probability we used the formulas we learned in class. To see these formulas and more of our project click on the learn more button below.
Stats Chapter 6
For this project me and Jolie studied more in depth about Binomial Probability and distribution. In our first body paragraph we explained and described a lot of the vocab we used throughout the chapter. Once you go to the actual project you will see. Next for the actual project part we had to figure out the probability that we would answer 7 answers correctly on a 10 question test that we guessed on for all the answers. To find out what the probability was click the learn more button below.
For this project me and Jolie studied more in depth about Binomial Probability and distribution. In our first body paragraph we explained and described a lot of the vocab we used throughout the chapter. Once you go to the actual project you will see. Next for the actual project part we had to figure out the probability that we would answer 7 answers correctly on a 10 question test that we guessed on for all the answers. To find out what the probability was click the learn more button below.
Stats Chapter 7
For the Chapter 7 Project I worked with Olivia Curtis and Viktor Bedaine. In this chapter project we took a random sample of 50 students at Fowler High School and asked them how many people are in their household. We used a simple random sample and collected our results using a google form. To see what we all calculated and created click the learn more button below.
For the Chapter 7 Project I worked with Olivia Curtis and Viktor Bedaine. In this chapter project we took a random sample of 50 students at Fowler High School and asked them how many people are in their household. We used a simple random sample and collected our results using a google form. To see what we all calculated and created click the learn more button below.
Stats Chapter 8
For the Chapter 8 project I worked with Cole and Nick. We took a set of data of 43 baseball players home run percentages and calculated three different confidence intervals. We also had to find the critical values of the same three intervals. Once we calculated everything we were able to see the range of what percentages were good and what were bad. To see all of our calculations and more info click the learn more button below.
For the Chapter 8 project I worked with Cole and Nick. We took a set of data of 43 baseball players home run percentages and calculated three different confidence intervals. We also had to find the critical values of the same three intervals. Once we calculated everything we were able to see the range of what percentages were good and what were bad. To see all of our calculations and more info click the learn more button below.

Stats Chapter 9
In this chapter I worked with Dante and we took a random sample of 30 students from FHS and asked them how much time they spend on Facebook a day. Once we collected our data we created null and alternate hypothesis so we could make a prediction on whether or not we reject or fail to reject our null compared to our alternate. To learn what these things are what our results were click the button below.
In this chapter I worked with Dante and we took a random sample of 30 students from FHS and asked them how much time they spend on Facebook a day. Once we collected our data we created null and alternate hypothesis so we could make a prediction on whether or not we reject or fail to reject our null compared to our alternate. To learn what these things are what our results were click the button below.
FOLLOW All OF MY STATS PROJECTS

